The analysis behind the reports · BFit
Same doubts,
different reasons
BFit is a Mexican wellness-supplement brand, and much of its audience follows its founder, known on Instagram as Brenvita. Every buyer got a short survey after checkout. Between July and November 2023, 3,554 buyers answered it.
The question I set out to answer: do buyers who arrive through the founder need something different from the product page? No customer details appear here.
Work sample based on survey data from my 2023 role at Unmade, re-analyzed in 2026 to show my process. Customer details are removed. Product actions are new proposals, not client-delivered outcomes.
The founder changes why people buy, not what worries them
of buyers said the founder brought them to the page, July–August vs September–November
named the founder as a reason for choosing BFit, founder-referred vs other buyers
said they worried the product would not work, founder-referred vs other buyers
Post-purchase survey, 3,554 buyers, 25 Jul – 29 Nov 2023. The first figure counts visits ("What brought you to our page today?"). The other two compare buyers by how they first heard of BFit, September–November only: 1,457 through the founder, 352 through other channels.
My part
- Role
- UX Researcher at Unmade Design Group
- Client
- BFit, a Mexican wellness-supplement brand
- What I did, 2026
- Data checks, pipeline coding, hand-coding of 240 answers, segment comparison and statistical tests
- Data
- Post-purchase survey export, 25 Jul – 29 Nov 2023, 3,554 buyers
The survey
The analysis below uses four survey fields shown here. The original survey had seven questions, in Spanish, translated here.
- Why us · open
- “What made you buy BFit rather than another brand?”2,464 usable answers
- Hesitation · open
- “What made you unsure before buying from BFit?”2,217 usable answers
- First heard · pick one
- “How did you first hear about BFit?”2,285 answers
- Today · pick one
- “What brought you to our page today?”2,266 answers
The original survey also recorded main reason, competitor considered and days to purchase. Those fields are used only in secondary checks, so they are omitted from this overview.
Data check
First, I caught a false trend in the survey export
In September, the answer options changed: “Other” collapsed while “Instagram – Brenvita” surged. Read literally, founder-driven discovery jumped from 9% to 77% in a month. That was a survey artifact, not buyer behavior.
I measured the trend with a question whose options stayed stable, then limited the founder-vs-other comparison to September onward.
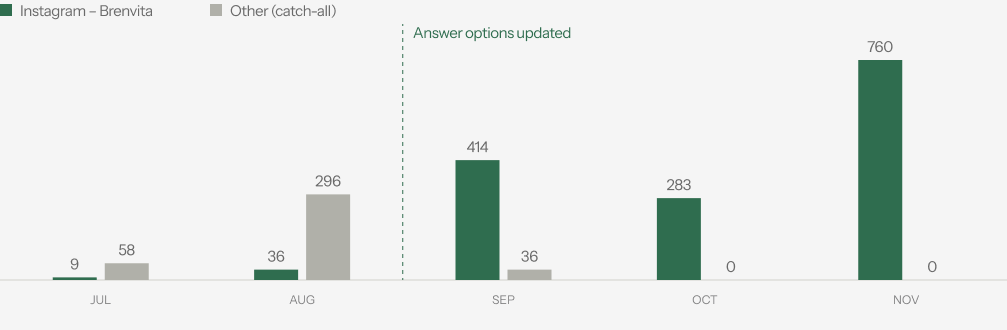
Read chart data
| Month | Instagram – Brenvita | Other (catch-all) |
|---|---|---|
| July | 9 | 58 |
| August | 36 | 296 |
| September | 414 | 36 |
| October | 283 | 0 |
| November | 760 | 0 |
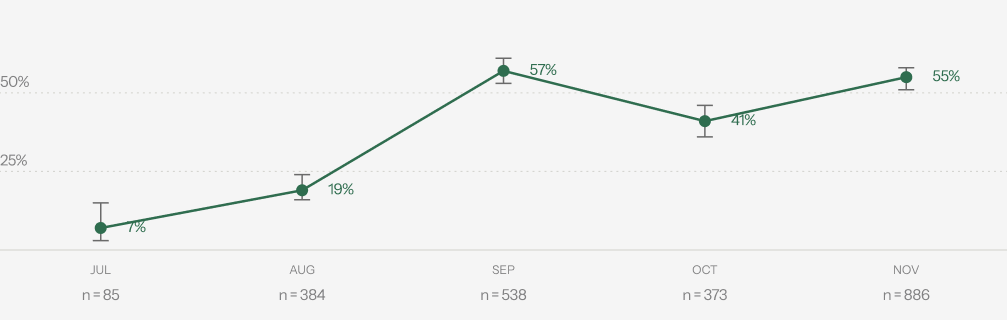
Read chart data
| Month | Founder share | Answers |
|---|---|---|
| July | 7% | 85 |
| August | 19% | 384 |
| September | 57% | 538 |
| October | 41% | 373 |
| November | 55% | 886 |
October dips to 41%. The survey does not record why, so I do not explain it. By November, more than half of visits came through one person, which is worth tracking every cycle.
Key finding
The founder changes why people buy, not what worries them
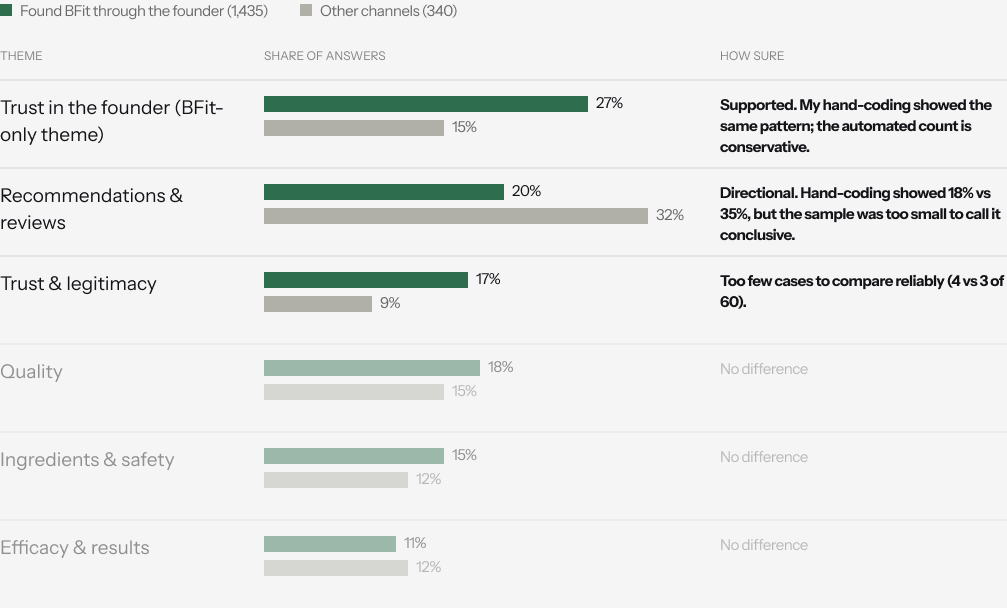
Read chart data
| Theme | Founder (1,435) | Other (340) | How sure |
|---|---|---|---|
| Trust in the founder (BFit-only theme) | 27% | 15% | Supported. My hand-coding showed the same pattern; the automated count is conservative. |
| Recommendations & reviews | 20% | 32% | Directional. Hand-coding showed 18% vs 35%, but the sample was too small to call it conclusive. |
| Trust & legitimacy | 17% | 9% | Too few cases to compare reliably (4 vs 3 of 60). |
| Quality | 18% | 15% | No difference |
| Ingredients & safety | 15% | 12% | No difference |
| Efficacy & results | 11% | 12% | No difference |
Founder-referred buyers often named the founder; other buyers leaned more on recommendations and reviews. Different source of trust, same core doubt.
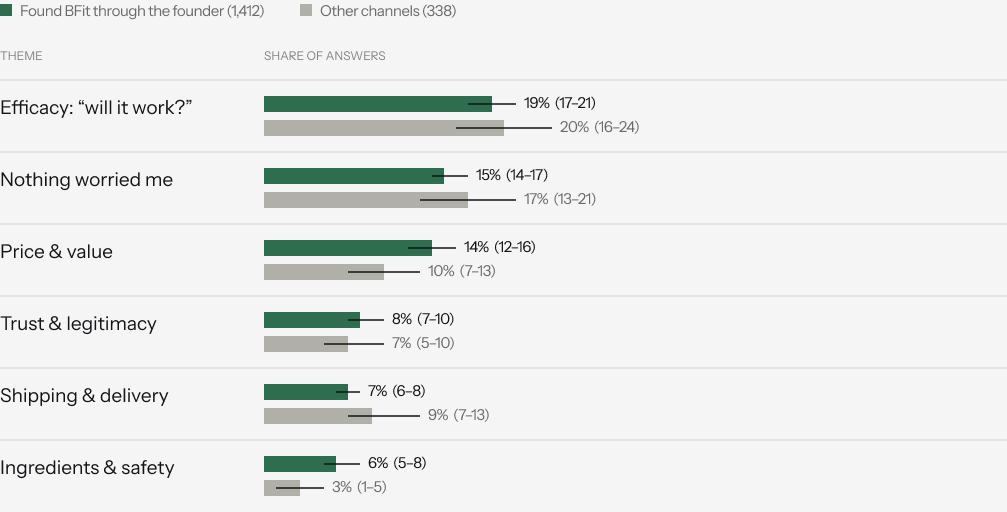
Read chart data
| Theme | Founder (1,412) | Other (338) |
|---|---|---|
| Efficacy: “will it work?” | 19% (17–21) | 20% (16–24) |
| Nothing worried me | 15% (14–17) | 17% (13–21) |
| Price & value | 14% (12–16) | 10% (7–13) |
| Trust & legitimacy | 8% (7–10) | 7% (5–10) |
| Shipping & delivery | 7% (6–8) | 9% (7–13) |
| Ingredients & safety | 6% (5–8) | 3% (1–5) |
Same doubts, different reasons. I tested nine hesitation themes, so I treated small differences cautiously. None was strong enough to separate the groups. The stable finding was efficacy: in my hand-coding, “will it work?” was 20% in both groups.
Product actions
Answer “will it work?” on the page, for everyone
Put the proof on the product page, not in the founder’s feed
- What I would recommend
- The efficacy doubt is the same size for every channel, so the answer cannot live only in founder content that nearly half the visitors did not arrive through. Put what the product does, how long it takes, and what supports it next to the add-to-cart, in plain language. Design it for a phone first, since founder traffic arrives from Instagram. Any wording about results has to stay within Mexico’s rules for supplement claims (COFEPRIS), so it would be checked with the brand before anything ships.
- This is a hypothesis
- The survey only reached people who bought, so it cannot show how many visitors this doubt stopped. It says the doubt is common among buyers, not that answering it will change who buys.
- How we would know
- A comprehension test with shoppers first: can they say what the product does and when they would notice it, without leaving the page. Then, in the next survey cycles, fewer buyers name “will it work?” as their doubt, in both channels.
Speak to each channel’s reason for trusting
- What I would recommend
- Buyers who came through the founder named her; others more often pointed to recommendations and reviews. Landing content for traffic that did not come through the founder should lead with reviews and social proof, not with a person they may not know.
- How we would know
- In the “why us” answers from buyers outside the founder’s channel, recommendations and reviews stay the leading theme, and the “other” bucket shrinks.
Validation & limits
What this sample can and cannot prove
Who this represents
Buyers only. The survey ran after checkout, so it cannot tell us why anyone did not buy. Comparisons show association, not cause.
How well the coding holds
I independently hand-coded 240 answers without seeing the pipeline labels. Overall, the two approaches matched moderately well. The core “will it work?” theme was much stronger: 92% of the pipeline labels matched mine, and it found 96% of the cases I found.
What I tested that did not hold
I expected buyers who came through the founder to buy faster, compare fewer brands and worry less about price. They did not.
How I coded it
The pipeline coded Spanish responses with a BFit-specific keyword guide plus two brand themes. It assigned 84% of “why us” answers and 77% of hesitation answers. Before reporting, I had set a maximum 25% unclassified rate.
Method details
Agreement by channel. Kappa 0.55 (founder) and 0.67 (other) on hesitation; 0.47 and 0.69 on “why us”. The pipeline catches about 6 in 10 founder-trust answers in both groups (5 of 8 and 3 of 6 in my sample: small counts), and fewer recommendation answers for founder buyers (5 of 11) than for others (15 of 21). I did not tune the vocabulary on these 240 answers, because that would inflate the agreement I report.
Tests. Two-proportion z-tests with a Holm correction across the nine themes per question, and Wilson 95% intervals. The trend: chi-square, p < 0.001.
What did not hold, in numbers. Same median of one day from first visit to purchase (Mann-Whitney p = 0.12). Considering another brand: p = 0.11. A first, rougher keyword pass suggested more price worry among founder buyers; with the pipeline’s coding and the correction, that difference disappears.